
From the Blog
Price Per Square Foot in San Antonio: What the $170 Figure Really Buys
The San Antonio metro's median listing price per square foot was about $170 in August 2026, per FRED and Realtor.com data, which is roughly 24% below the national median of $223. That gap is the single clearest number behind San Antonio's affordability story. But price per square foot is a blunt instrument: it swings wildly between the far-west new builds, the inner-loop resale neighborhoods, and the Hill Country perimeter. Here is how to read the metric honestly before you compare two homes.
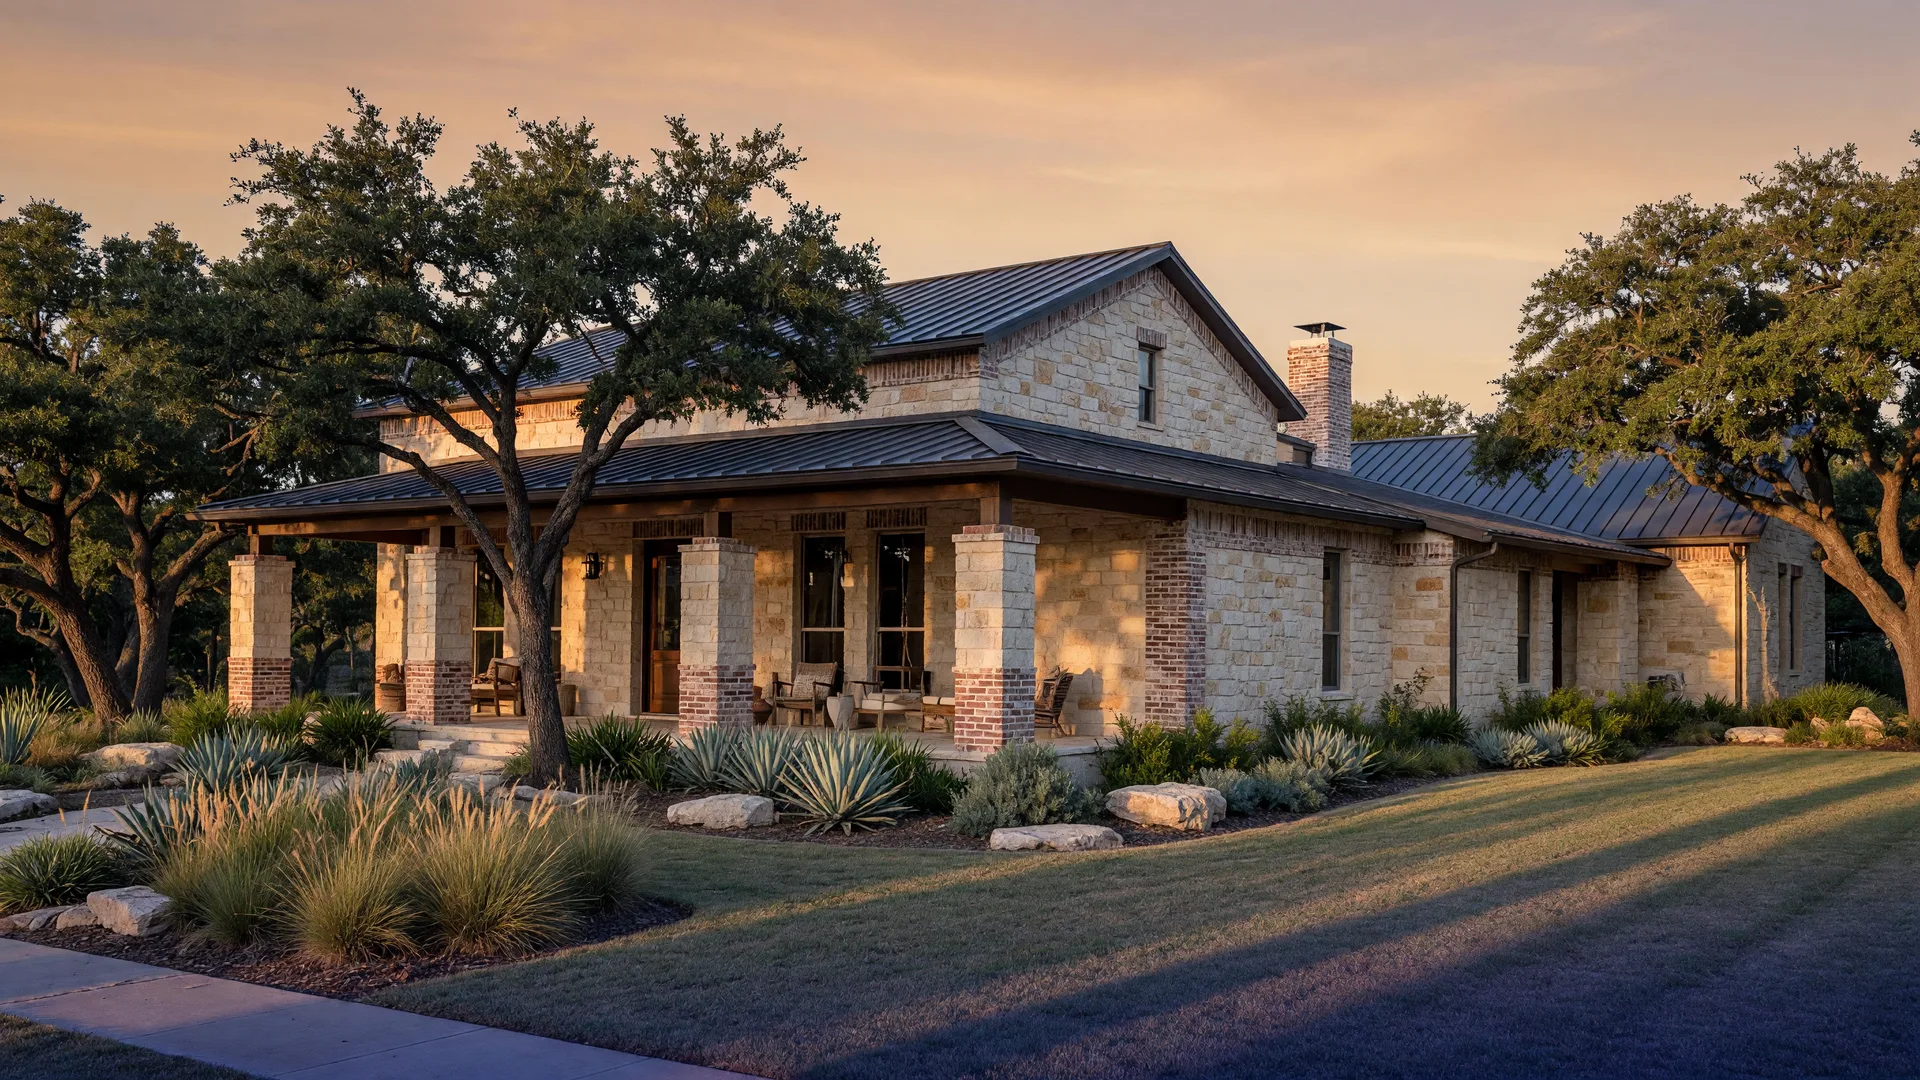
The San Antonio metro's median listing price per square foot was about $170 in August 2026, per FRED and Realtor.com data, which is roughly 24% below the national median of $223. That gap is the single clearest number behind San Antonio's affordability story. But price per square foot is a blunt instrument: it swings wildly between the far-west new builds, the inner-loop resale neighborhoods, and the Hill Country perimeter. Here is how to read the metric honestly before you compare two homes.
For the broader payment and budget picture behind those per-square-foot numbers, this is the cost-of-living video I point relocating families to.
On my channel: The TRUE Cost of Living in San Antonio, Texas
The $170 figure and where it comes from
FRED, using Census and Realtor.com data, puts the San Antonio-New Braunfels metro's median listing price per square foot at about $170 as of August 2026, easing slightly from roughly $172 earlier in the summer. Sale-price-based local estimates run a bit lower, around $148 to $153 per square foot, depending on the source and geography. Whichever number you use, the point holds: in dollar terms, a square foot of living space in San Antonio is meaningfully cheaper than in most of the country.
How San Antonio compares to the nation
The U.S. median listing price per square foot was $223 in September 2026, and $224 in August. Against that, the San Antonio metro's $170 figure is roughly 24% lower, about $53 a square foot cheaper. On a 2,000-square-foot home, that gap is more than $100,000 in purchase price before you get to Texas's lower income-tax structure. It is the honest arithmetic behind the families relocating from California and Colorado every year.
Why the metric swings so much within San Antonio
A metro-wide average hides the real spread. Brand-new master-planned communities with pools, clubhouses, and MUD taxes quote one price per foot; older established resale neighborhoods quote another; and Hill Country towns like Boerne run meaningfully higher for the same footage. Two homes with identical square footage can differ by $100 a square foot or more based on location, lot, school zone, and condition. The per-foot number is a starting point for comparison, never a substitute for comps of similar homes.
How to use price per square foot without fooling yourself
- Compare like with like: use per-foot only among homes with similar age, size, lot, and location. Mixing a 1990s resale with a brand-new build tells you nothing useful.
- Watch floor-plan efficiency. A 1,800-square-foot home with a wasted hallway and a 1,700-square-foot home with a great layout are not the same product at the same per-foot price.
- Add the lot. Texas homes often sit on generous lots; a lower per-foot figure can simply mean more land is priced into the same total.
- Confirm what counts. Some listings divide by air-conditioned square footage, while others include porches and garages, which changes the number on paper.
- Always double-check with sold comps. The per-foot figure flags value; the comparable sales confirm it.
What it means for your search in 2026
In a balanced market with more inventory, the buyers who shop per-foot smartly tend to find the genuinely undervalued listings: homes priced below their neighborhood's per-foot norm for no structural reason. That is the kind of negotiation that saves real money. Get pre-approved, build your comp list, and let the per-foot number point you toward the listings worth a second look rather than decide for you.
Frequently asked questions
Is San Antonio really cheaper per square foot than most of the country?
Yes. The San Antonio metro's median listing price per square foot was about $170 in August 2026, per FRED and Realtor.com data, roughly 24% below the U.S. median of $223. Sale-price-based local estimates run a bit lower, around $148 to $153 per square foot. The exact figure depends on whether you look at listings or closed sales, and where in the metro you look.
Why is price per square foot so different between two similar homes?
Location and lot usually drive most of the difference, followed by age, condition, school zone, and floor-plan efficiency. A metro average also blends new master-planned communities with older resale neighborhoods and Hill Country towns. For that reason, per-foot comparisons work best between similar homes in the same area, never across the whole city.

Written by Phyllis Domingo
REALTOR® · TX License 745926 · 100+ homes sold · Helping families move well in San Antonio and the Hill Country since long before the hard part became normal.
Have a question about this topic?
Every family's situation is different. Send me a note and I will respond personally, usually within a business day.